Protractor Online for Images and PDFs
Upload a visual source or start with a lightweight example, then choose the method that matches the geometry: three points for a corner, multiple numbered rays from one vertex, four endpoints for intersecting lines, or a transparent scale for manual alignment. Files remain in this browser during normal use, and every numeric result depends on the points or overlay you place.
Measure on the canvas
Click or tap to add measurement lines. Drag line points, the center point, or the side handles to adjust.
Advanced Mode
Choose the measurement method before placing points
Three-point angle mode uses the movable protractor center as the vertex and two draggable endpoints as rays. Multiple rays mode keeps 2 to 12 numbered endpoints around that same vertex and labels every angle between adjacent ray directions. Two-line intersection mode uses four endpoints and compares the direction of the two complete lines, so the crossing point can sit outside the visible crop. Transparent overlay mode reports the rotation of the protractor baseline while leaving the tick scale visible for a manual reading.
The Geometry, Roof, Ramp, Blueprint, and Screenshot buttons draw small Canvas examples instead of downloading demonstration files. Roof and Ramp reveal slope conversions because those contexts have a meaningful horizontal baseline. Geometry, Blueprint, and Screenshot keep the result focused on degrees, radians, complement, supplement, and reflex angle.
Measure an angle on an image or PDF
- Choose an example, upload a PNG/JPG/WEBP image, paste a screenshot, import a PDF page, or begin on the blank canvas. PDF.js renders only the page you select in this browser.
- Select Three-point angle, Multiple rays, Two-line intersection, or Transparent overlay. The instruction immediately below the mode buttons states how many points or handles the method uses.
- Zoom with the wheel or trackpad and place points on long, clear portions of each edge. For a three-point reading, drag the overlay center onto the vertex; for two lines, mark both ends of each line.
- Check whether the smaller, supplementary, or reflex value answers the actual task. Slope and roof-pitch conversions appear only for a roof, ramp, or slope-specific context.
- Save useful readings, give each one a descriptive name, hide or reorder comparisons, and export only after the visible annotation matches the source.
What the browser calculates
- For points A–V–B, the three-point angle is arccos(((A−V)·(B−V))/(|A−V||B−V|)). The displayed interior result is between 0° and 180°.
- Multiple rays uses the same vector calculation after sorting numbered endpoints around the shared center; the canvas labels each adjacent pair and saves the complete ray set.
- For lines P1–P2 and Q1–Q2, the direction difference is reduced to the smaller intersection angle between 0° and 90°; its supplement describes the other angle at the crossing.
- Complement is 90°−θ only when θ is no greater than 90°. Supplement is 180°−θ. Reflex is 360°−θ for a nonzero interior angle.
- Percent grade is 100×tan(θ), slope ratio is 1/tan(θ), and roof pitch is 12×tan(θ). Those conversions require θ to describe rise from a level baseline.
- Point spacing improves repeatability but cannot correct perspective, lens distortion, scan skew, or an edge that is not in the same plane as its reference.
Worked measurement examples
- Geometry example: place the vertex at (560, 420), one ray at (835, 420), and the other at (690, 195). The vectors point right and up-right; the calculated smaller angle is about 60°. Moving the far endpoint by a few pixels changes the answer less than moving a point close to the vertex.
- Two-line example: mark endpoints on each of two blueprint diagonals. The algorithm compares line direction, not the apparent crossing location. If the smaller direction difference is 72°, the adjacent angle at the same intersection is its 108° supplement.
- Roof example: a side-on profile measures 26.57° above a verified horizontal baseline. tan(26.57°) is approximately 0.5, so the contextual outputs are 50% grade and about 6 in 12 pitch.
- Screenshot example: enlarge a thin diagram before placing points and share an annotated PNG. The export documents point placement; it does not make the source more accurate.
Canvas controls that keep the measurement adjustable
A practical tool should feel closer to a working measuring surface than a static ruler image. This browser workspace keeps the drawing, photo, PDF page, or blank canvas visible while you adjust the protractor center, size, rotation, opacity, and color preset.
Use the canvas controls when the source is not perfectly aligned. You can zoom the canvas, move the overlay, rotate the protractor, add several measurement lines, compare saved angles, and export the result when the setup is clear enough to share.
- Use grid and guide settings when the overlay needs a horizontal, vertical, or repeated spacing reference.
- Use color presets when the tick marks need stronger contrast against a dark drawing, blueprint, or light worksheet.
- Use PNG, PDF, CSV, Excel, JSON, or SVG export when a measurement needs a reviewable record.
When the browser tool fits better than an angle meter
A phone angle meter is useful when the device can physically rest on a surface. A workspace is better when the angle already exists in a screenshot, classroom diagram, scanned PDF, CAD export, map crop, roof photo, or blueprint image.
This browser protractor is also useful when you need to explain how the angle was read. The visible vertex, side points, protractor overlay, angle label, and export table make the result easier to audit than a single number typed into notes.
- Choose the workflow for remote review, homework, diagrams, and files that cannot be measured with a physical tool.
- Choose a calibrated physical tool when fabrication, safety, or compliance depends on the final angle.
- Use both methods when the browser result is a first pass and the real object still needs a field check.
Accuracy, local files, and appropriate use
This is browser-based visual measurement for planning, learning, and documentation. It measures the rendered pixels and marks you provide, not an unseen three-dimensional object. Perspective can make parallel or perpendicular real-world edges appear to converge; scans can be rotated; compressed screenshots can blur the exact edge. Safety-critical or regulated work requires suitable calibrated instruments and qualified review.
Images and selected PDF pages are decoded and drawn locally. The workspace does not send file bytes, canvas pixels, point coordinates, notes, or sensor readings to analytics. Generated PNG, SVG, CSV, JSON, spreadsheet, and PDF files are created on the device; temporary object URLs are revoked when a source changes.
Angle learning guides
Learn Angle Basics with Visual Guides
This page is more than a free protractor online. It also gives you a beginner-friendly way to understand what angle measurements mean. Use the visual guides below to learn angle types, angle units, angle relationships, and real-world angle measurement examples while you measure angles online.
Types of Angles
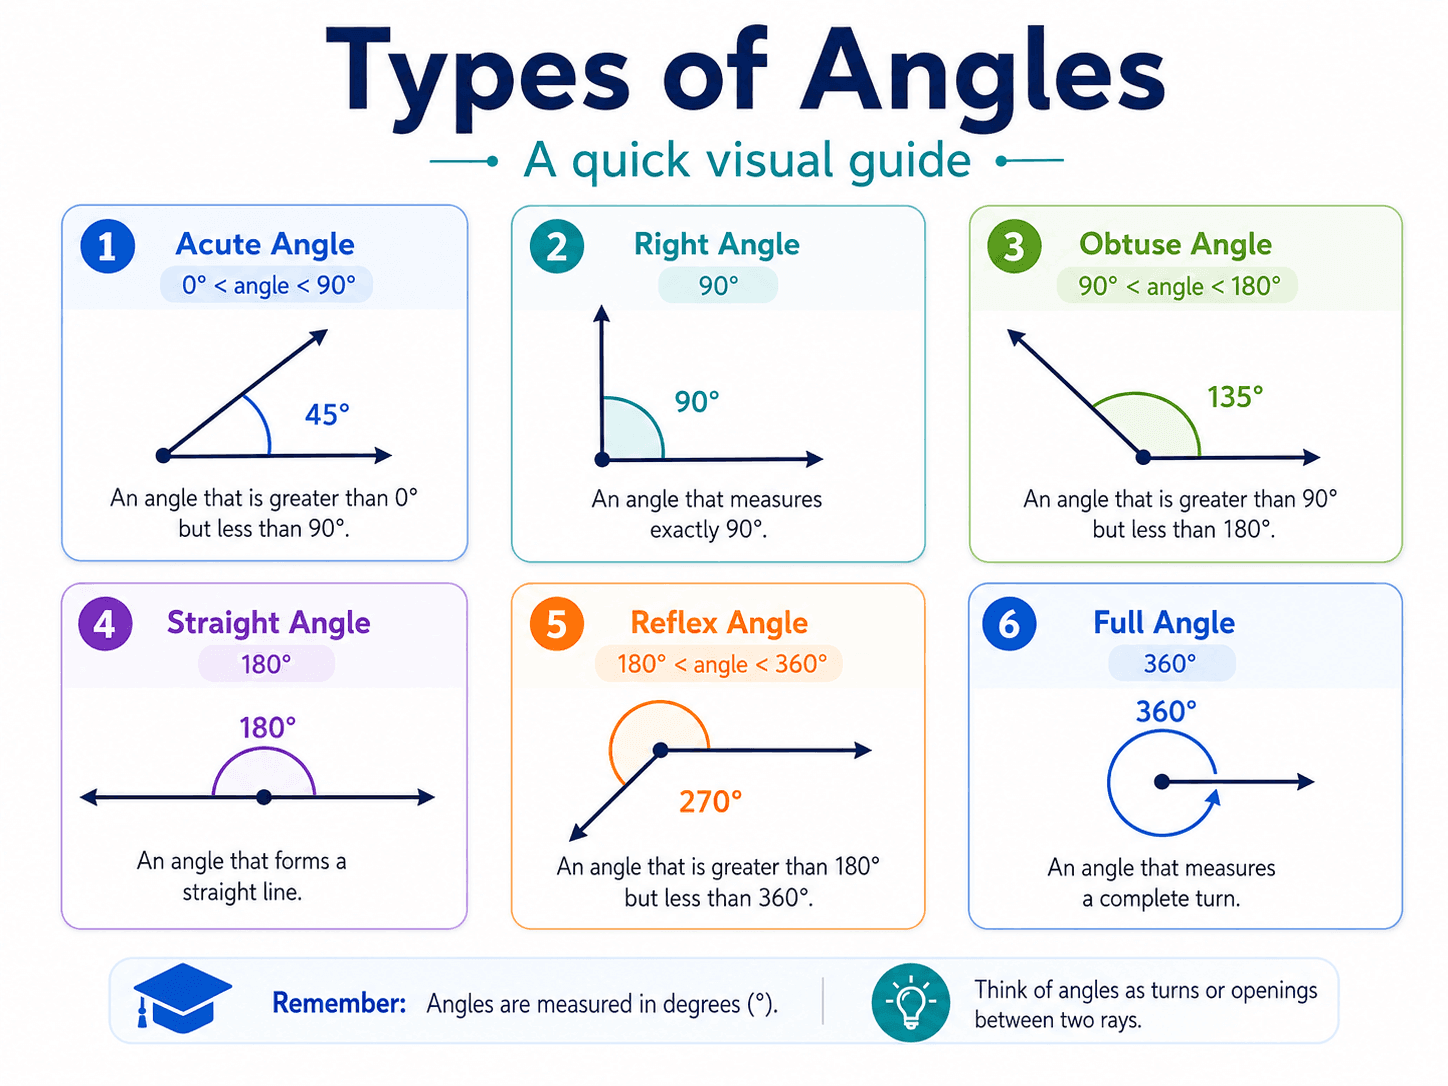
Before you measure with a protractor online, it helps to know the angle types you are likely to see. An acute angle is smaller than a right angle, while a right angle is the square 90 degree corner used in grids, rooms, and geometry diagrams. An obtuse angle opens wider than 90 degrees but stays below a straight line.
A straight angle is exactly 180 degrees. A reflex angle continues past a straight angle and is greater than 180 degrees, and a full angle represents one complete turn back to the starting direction. Understanding these angle types makes the number from a protractor online easier to read, because you can quickly tell whether a result should be acute, right, obtuse, straight, reflex, or a complete rotation.
- Acute angles are smaller than 90 degrees.
- Right angles measure exactly 90 degrees.
- Obtuse angles are larger than 90 degrees but smaller than 180 degrees.
- Straight angles measure 180 degrees.
- Reflex angles are greater than 180 degrees.
- Full angles represent a complete turn.
Angle Units Explained
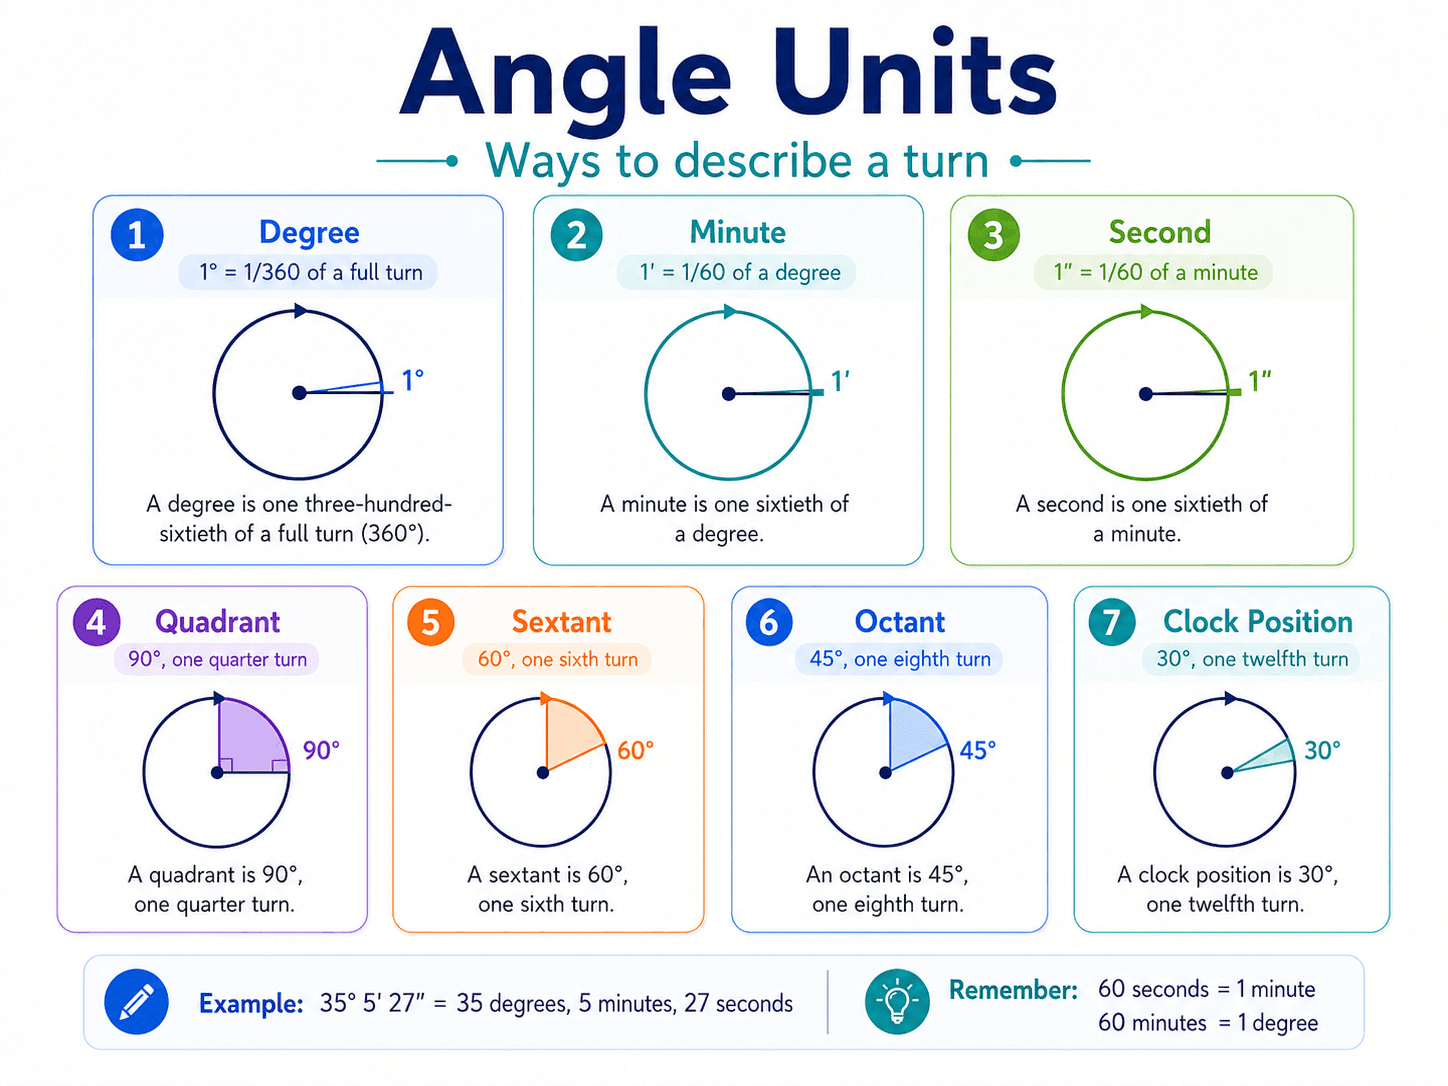
Most people using a protractor online will read angles in degrees, because a degree is the standard unit printed around a physical protractor and shown by most digital protractor tools. One degree is 1/360 of a full turn. For finer descriptions, a minute is 1/60 of a degree, and a second is 1/60 of a minute. For example, 35° 5' 27" means 35 degrees, 5 minutes, and 27 seconds.
Other angle units are useful when a turn is divided into familiar parts. A quadrant is 90 degrees, a sextant is 60 degrees, an octant is 45 degrees, and each hour position on a clock face spans 30 degrees. You may not need minutes and seconds for quick protractor online work, but knowing these units makes geometry, navigation, astronomy, and map reading easier to understand.
- One degree equals 1/360 of a full turn.
- One minute equals 1/60 of a degree.
- One second equals 1/60 of a minute.
- A quadrant divides a turn into 90 degree parts.
- A sextant is 60 degrees, and an octant is 45 degrees.
- Clock positions divide a full turn into 30 degree steps.
Angle Relationships
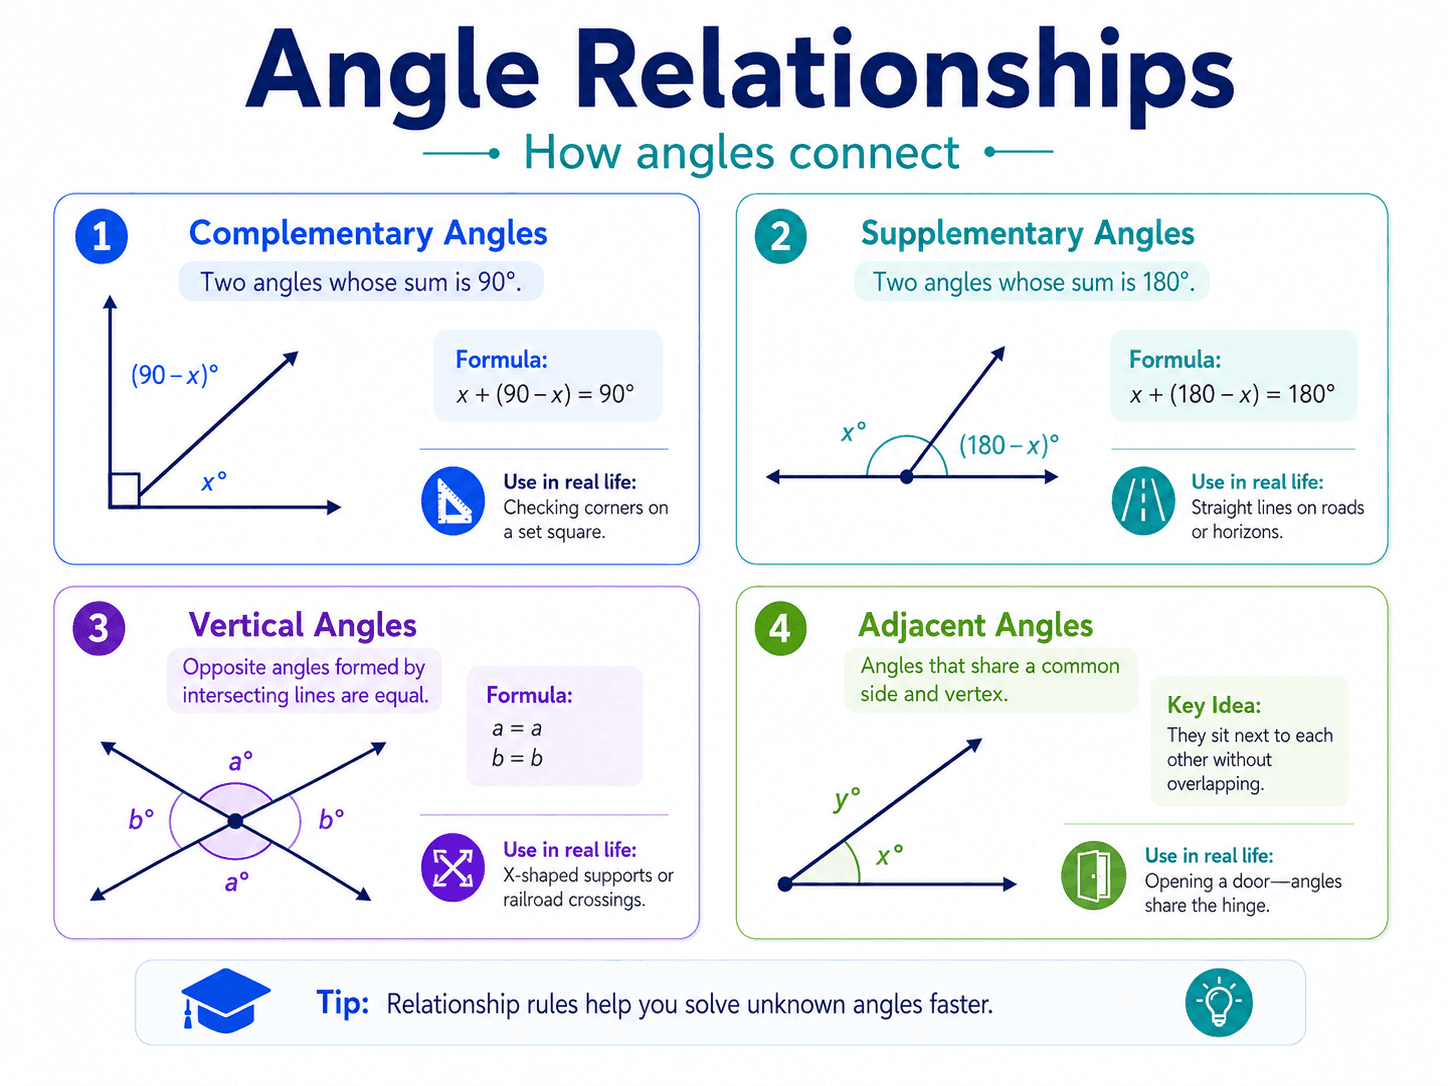
Angle relationships explain how separate angles work together. Complementary angles add to 90 degrees, so they often appear around right-angle corners. Supplementary angles add to 180 degrees, which makes them useful when a straight line is split into two parts. When two lines intersect, vertical angles sit opposite each other and have equal measurements.
Adjacent angles share a vertex and one side, so they are common in diagrams, furniture plans, construction sketches, and geometry homework. These relationships matter when you measure angles online because a digital protractor may give one angle, while the problem asks for its complement, supplement, opposite angle, or neighboring angle. Recognizing the relationship helps you interpret line intersections instead of treating every reading as an isolated number.
- Complementary angles are useful when two parts complete a right angle.
- Supplementary angles help check measurements along a straight line.
- Vertical angles should match when two straight lines cross.
- Adjacent angles share a side and a vertex.
- Relationships help turn one measured angle into the value a problem actually asks for.
Angles in Real Life
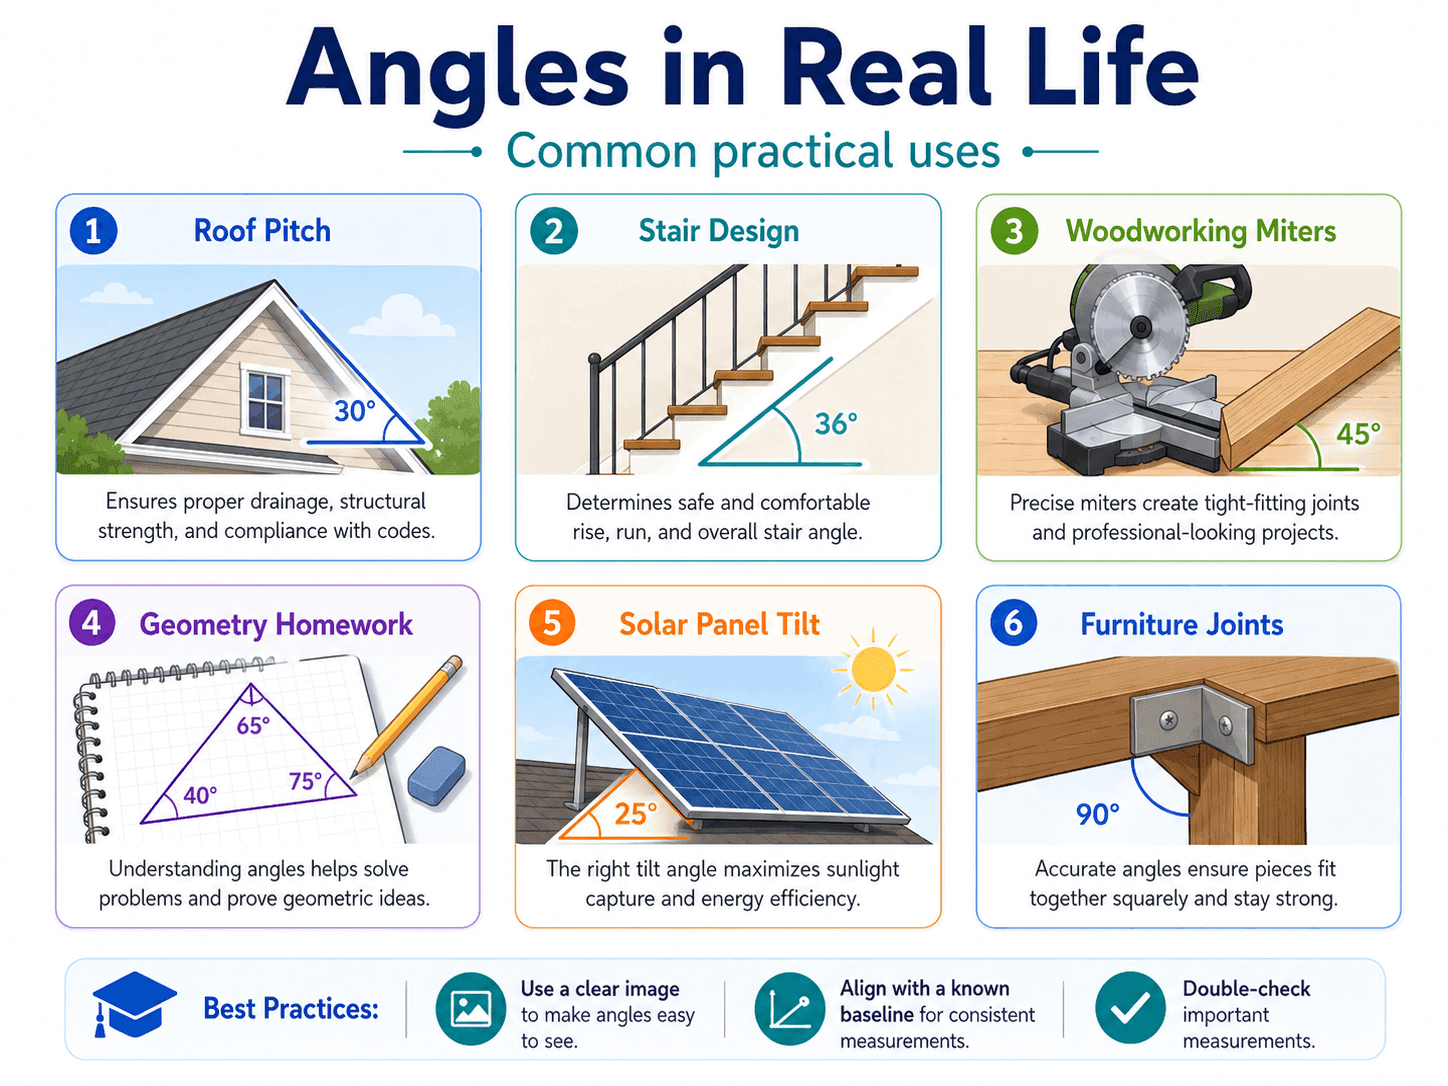
Angle measurement is not only a classroom topic. Roof pitch describes how steep a roof is, a stair angle affects how a stair run feels, and woodworking angles control whether miters and furniture joints close cleanly. Geometry homework uses the same ideas in a simplified setting, but the underlying skill is still about reading direction, rotation, and the space between two lines.
Solar panel tilt is another practical example because the panel angle affects sun exposure through the year. A protractor online tool is useful for quick visual checks on photos, diagrams, screenshots, plans, and learning materials before you move to a calibrated tool. Use it for roof pitch angle estimates, stair angle review, woodworking angles, and visual geometry checks when a fast browser-based measurement is enough for planning or explanation.
- Check roof pitch on a photo before writing a planning note.
- Compare stair angle examples while reviewing layout sketches.
- Inspect woodworking miters or furniture joints from reference images.
- Use diagrams and screenshots to support geometry homework.
- Estimate solar panel tilt from a plan before doing a field measurement.
Calculation tools
Move from a measured angle to the notation you need
After measuring, use the angle unit converter for radians, turns, arcminutes, arcseconds, gradians, or NATO mils. The miter joint calculator keeps cut-line and saw-setting conventions separate, while the polygon formulas explain regular interior, exterior, and central angles. For map direction notation, open the bearing and azimuth converter.
Why Learn Angles on a Protractor Website?
Many visitors arrive because they need to measure one angle quickly. That is still the main job of this protractor online, but a better grasp of angle types, units, and relationships helps you place points more carefully and question results that do not fit the drawing. ProtractorOnline.org combines a practical protractor online tool with short educational guides so measurement and understanding support each other.
Perspective check
Why a photo can change the visible angle
A square photographed straight on keeps four visible right angles. Tilt the same plane away from the camera and its parallel edges converge toward vanishing points; the projected corners need not measure 90°. The browser can measure that projection precisely without recovering the original physical angle.
Frequently Asked Questions
Which mode should I use for a visible corner?
Use three-point angle mode. Move the center marker to the corner, then place one endpoint along each side. Longer visible ray segments generally make small pointer errors less influential.
How do I measure several angles from the same vertex?
Choose Multiple rays, move the center marker onto the shared vertex, then click 2 to 12 ray endpoints. The endpoints stay numbered and the canvas labels the angle between every adjacent ray direction; Undo point removes the latest ray.
How does two-line intersection mode differ?
It takes four endpoints—two for each line—and compares the lines' directions. This is useful when the true intersection is outside the crop or when a blueprint contains long crossing centerlines.
What does transparent overlay mode measure?
It reports the overlay baseline rotation and displays the 180° or 360° tick scale. Align the center and baseline manually; the browser does not claim to detect an edge automatically.
Why are roof pitch and percent grade sometimes hidden?
Those values assume an angle measured from a level horizontal baseline. They appear for Roof and Ramp examples and slope-specific pages, but stay hidden for generic geometry and document review.
Are uploaded images or PDF files sent to a server?
No file-upload endpoint is used by the workspace. The browser opens images with a temporary object URL and renders selected PDF pages locally. Site analytics receive ordinary page-use data, not workspace files or measurements.
Can this result approve engineering or survey work?
No. A browser reading can support planning, learning, annotation, and discussion. Use calibrated equipment and qualified review when safety, regulation, fabrication tolerance, medical decisions, or legal boundaries depend on the answer.
Related tools